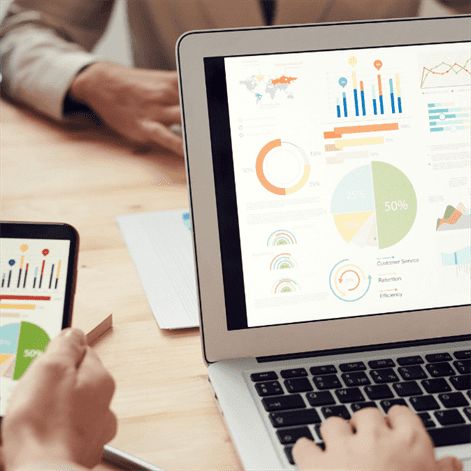
Business Analytics - Visualize your business data to make better business decisions

Utilize visualization tools to identify market patterns and capture current trends
-
Using several modern tools and technologies, Cuelebre's data visualization experts organize and present your data clearly and concisely, allowing you to utilize it to its fullest potential. In this way, you can identify KPIs, build dashboards, and gain insight into real-time metrics, trends, and potential usage strategies.
We also incorporate machine learning into day-to-day operations and enables you to make better, informed decisions at each stage of the process. This allows your organization to make better decisions and increase customer satisfaction through data visualization.
Integrate top-of-the-line visualization tools to improve your business methods
.png)
.png)
Identify patterns in complex problems and make solutions more precise with visualization.
Utilize top BI tools and technology to identify market trends and gain valuable insights and enjoy additional benefits such as:
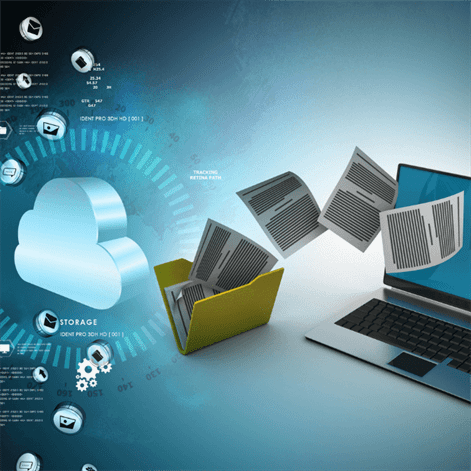
Utilizing BI tools and technologies can quickly gain meaningful insights and qualified values from large data sets. As a result, your organization can reap the benefits of data visualization tools by identifying relevant patterns insights and improving your business performance in the long run.
The tools used for data visualization manipulate and interact with your business data, providing actionable insights through multi-dimensional representations that, unlike one-dimensional charts and tables, provide organizations with different perspectives on data and promote better, faster decisions.
Your organization can better comprehend the data relationships by visualizing and highlighting them. In addition, you can prioritize your data and focus on your limitations to drive your business by analyzing the patterns.

The best way to identify inaccurate data is to visualize it. That way, it can be removed from the analysis at an early stage, which prevents further problems.
Using Data Visualization tools, you can identify the latest trends in your business to provide quality products and find quick solutions to complex problems. In addition, you can discover revenue-generating opportunities and increase profits for your business by understanding the current trends.
We use different BI tools to produce valuable results and qualitative outcomes.
After analyzing your organization's profile & operations, we select & implement the most appropriate modern BI tools.
Services
Using your business goals and KPIs, we design interactive dashboards & reporting elements that help you better understand the data.

You can rely on Cuelebre to deploy enterprise-wide data analytics solutions and optimize existing implementations.

At Cuelebre, we provide training and mentoring on a wide variety of essential & relevant BI tools so that your team can get up to speed with the latest technologies & modern processes.